A Post By Thomas P Tylutki PhD Dpl ACAN,President AMTS LLC
![]()
The evolution of the CNCPS continues. Moving from 6.1 to 6.5 biology introduces a series of changes. These include:
- Adopting aNDFom
- When available, using a multi-time pointNDFD to calculate the CHOB3kd based upon a new non-linear dynamic model from the VanAmburgh research group at Cornell.
- These include 30, 120 and 240 hr for forages
- For non-forages, 12, 72 and 120 hrs.
- Using the 240 for forages and the 120 for non-forages uNDF as carbohydrate fraction C instead of lignin x 2.4
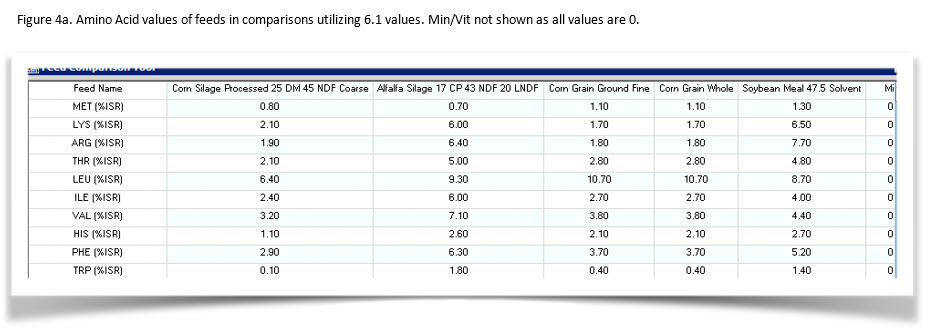
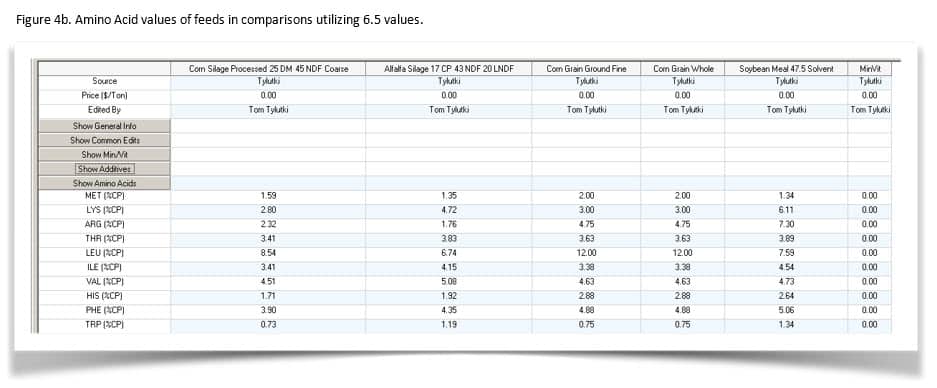
- Updated amino acid values expressed as %CP
- Updated amino acid efficiencies of use for lactating dairy cows combining maintenance and lactation.
- Ability to utilize uN Ross to characterize protein intestinal digestibility.
Of course, when these changes were implemented, changes in predictions happened. The objective of this document is to compare CNCPS 6.1 to AMTS 3.5.8 and then CNCPS 6.5 to AMTS 4.0 to show where these differences are between model biology and also to highlight what to expect in AMTS 4.0.
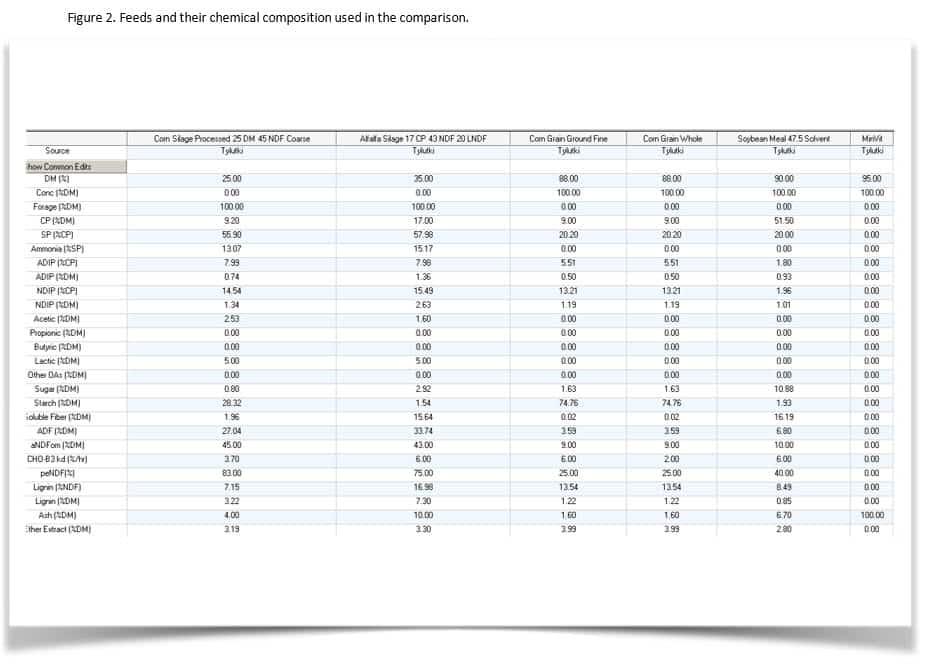
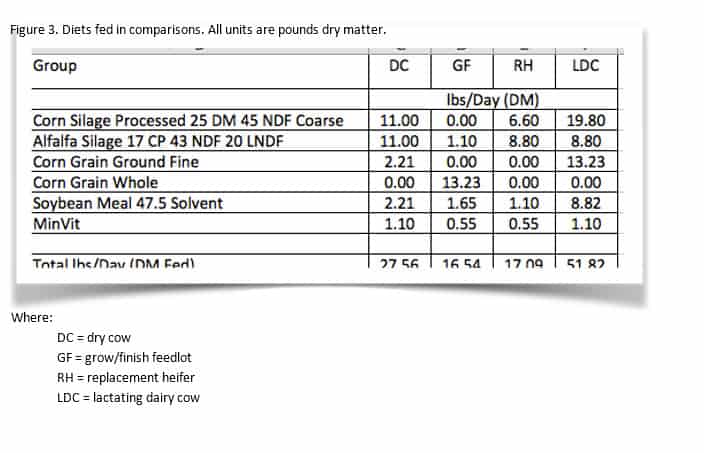
Example diets were inputted into CNCPS 6.1 and 6.5. These files where then imported into their respective AMTS versions. Diets compared were for: lactating cows, dry cows, replacement heifers, and grow/finish cattle. For all, the default inputs describing the environment and cattle inputs were used. Feeds were selected from the library and not modified (thus, all book values were used).
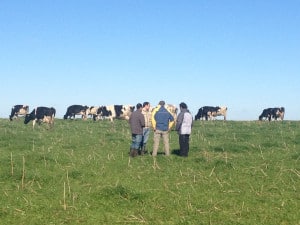
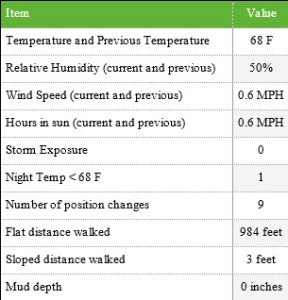
Location inputs were:
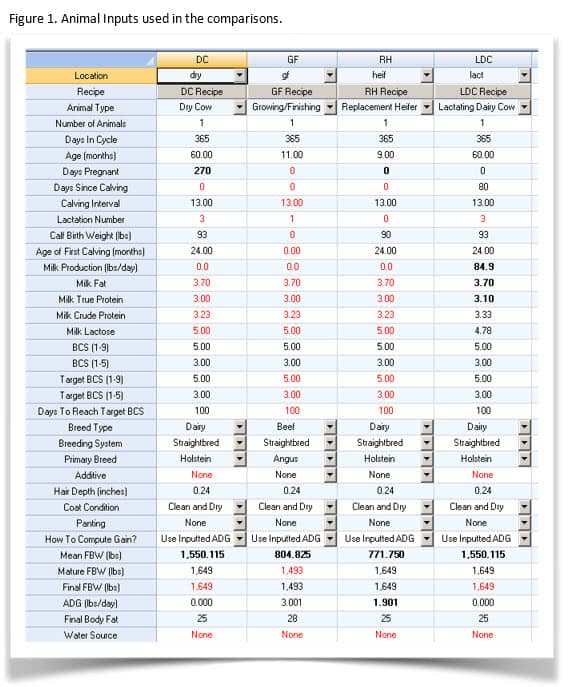
Animal inputs are shown in Figure 1
Figures 4a and b show the amino acid values for the feeds.
Results
There are several sets of results that will be shown and discussed. The first is simply showing common outputs for the four versions compared. The second set will highlight differences in amino acids, and the third illustrates the impact of using the new components on predictions.
For the common outputs, ME and MP supply and required are shown. Since these four outputs encompass the entire model, they represent an aggregate of all model predictions. Lysine and Methionine MP supply and required and percent MP are shown.


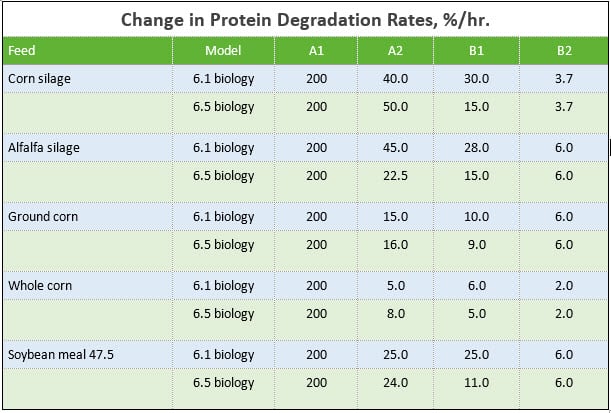
As shown in the ME and MP Supply and Required table, AMTS and CNCPS are consistent in their predictions within model version. For lactating cows, replacement heifers, and grow/finish, ME supply and required is EXACTLY the same be it 6.1 or 6.5 biology. The shift in MP supply from 6.1 to 6.5 biology is due to updated protein degradation rates for feeds. These shifts are shown in the Change in Protein Degradation Rates table. The majority of the changes occurred in the B1 protein pool rates. Given the sensitivity of this pool in relation to passage rates, reducing the kd rates results in lower protein degraded, thus increasing the rumen escape fraction. As an example, if a 6%/hr kp is assumed, for soybean meal in 6.1 biology, 80.6% would be degraded (calculated as kd / (kd + kp)). In 6.5 biology, 68.75% is degraded. These changes in the protein rates are part of the overall feed library update.
The shift in ME and MP required for dry cows is due to the Scale Weight Switch. Given the confusion regarding the scale weight input, we wanted to illustrate the difference this makes between setting the switch to TRUE and setting the switch to FALSE. The requirements shown in the illustration for 6.1 and 4.0 is with the switch set to FALSE ; thusly the model assumes the body weight inputted is conceptus free. Thus in pregnant animals, the body weight used internally is not adjusted for things such as maintenance requirements. Historically, if the scale weight was set to TRUE, the calculated conceptus weight would be subtracted from the inputted body weight. The data used to develop the requirements and intake equations are mixed as to whether they included conceptus weight or not. The information for the decision to use this input can be confusing: the default switch is set to TRUE, this chart shows the result of changing to FALSE.
The Methionine and Lysine Supply and Required table illustrates the big changes in predictions you will come across immediately upon loading a farm in AMTS 4.0. Given that all amino acid values have been updated in the feed library, and the updated protein kd rates, MP allowable production and amino acid supply values all change. Some of the larger shifts occur in methionine as the old analytical methods were poor resulting in as much as 50% of the methionine being destroyed. Of course the largest amino acid changes occur in lactating cows. In addition to the updated library, the change in efficiency of use resulted in massive shifts. The factorial system now aligns with ratios such as %MP. A new value that will be discussed integrates amino acids with energy supply. Maximizing milk protein yield appears to occur when MP MET:ME Mcal is 1.1 to 1.15:1; for lysine this value would be 2.9-3.0:1.
As this comparison has shown, using the existing carbohydrate degradation rates and aNDFdm has minor changes on the ME and MP balances when moving from 6.1 to 6.5 based biology. And, AMTS is consistent with the official CNCPS version. The shift in amino acid values result in improved predictability and accuracy for all rations. Coupled with the amino acid values changing, switching the units to %CP from %ISR means we will be slowly seeing the feed analytical laboratories reporting amino acids for feeds.
The Next Step…
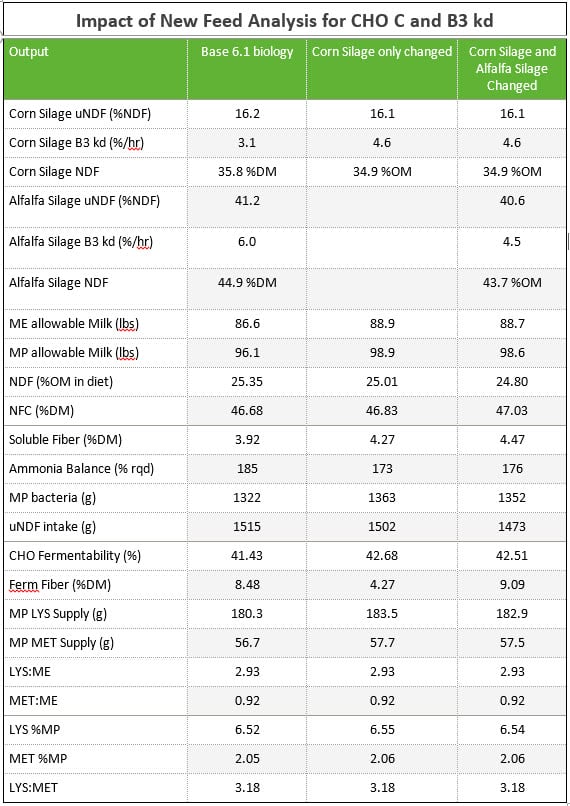
The next step in implementing 6.5 biology is switching to aNDFom, the new kd and CHO-C calculations, and the uN Ross for protein digestibility. Using AMTS 4.0 coupled with forage analysis for a corn silage and alfalfa silage, the examples were rerun for the lactating cow. The corn silage and alfalfa analysis were are real samples from a herd in central NY. In order to show the uNDF (g) for the basal diet, all feeds had uNDF inputted in the feeds screen as (lignin %DM x 2.4). When the new 240 hr NDFD is inputted, this invokes a couple switches within CNCPS and AMTS. First, instead of using lignin x 2.4 for CHO C, it uses the uNDF 240 (100 – NDFD 240). Second, it updates the inputted uNDF for the feed to represent the calculated uNDF from the inputted data. And it uses the new calculated CHO B3 kd (for both CHO B3 and PRO B2 kds).
aNDFdm to aNDFom
These silages had low soil contamination as seen in the difference between aNDFdm and aNDFom. The difference in the corn silage was near 1 unit while the alfalfa was 1.2 units. Even with these small differences, notice how the dietary NDF content changed (25.35 to 24.80%). It is very important to realize that as the shift to aNDFom occurs, dietary NDF concentration is going to DROP while NFC and soluble fiber may INCREASE. Nutritionists and producers must be aware of these shifts as old targets for NDF are NOT applicable.
NDF pools and rates
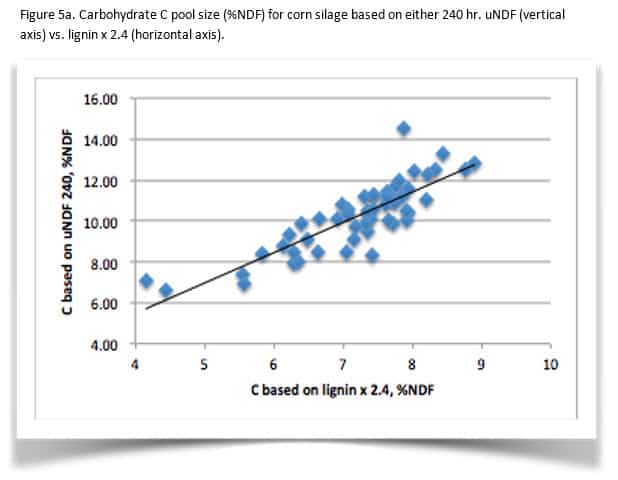
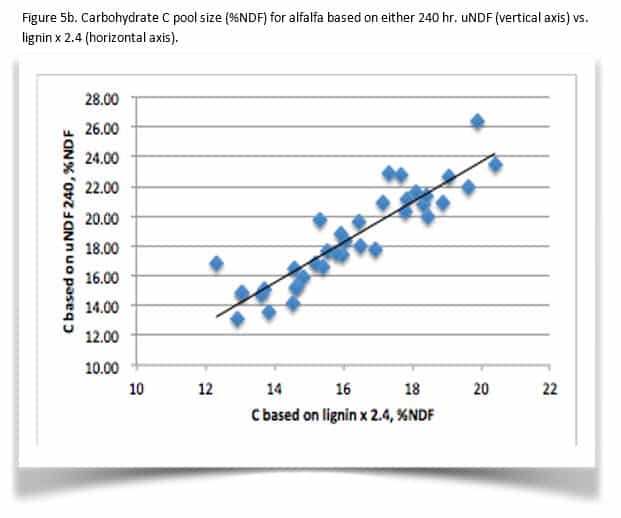
The shift in CHO B3 and C pools is variable. While this example shows close agreement between the old and new methods, this is not always the case. Figure 5 illustrates the differences between C pools from a population of corn silage (Figure 5a) and alfalfa (5b). In general, CHO C pool size increases. In the dataset, alfalfa C pool averaged 14% greater using uNDF with a range of -2 to +36% compared with lignin x 2.4. For corn silage, C pool is 42% larger with a range of 12 to 84% larger for uNDF. Comparing CHO B3 kd, the corn silage average kd is 11% higher in this dataset with a range of 14% slower to 38% faster then the kd calculated from the single time point. The alfalfa CHO B3 kd averaged 25% faster with a range of -12 to +142%. It is clear from this limited dataset that determining uNDF240 coupled with the new non-linear B3 kd calculations are more sensitive in evaluating fiber digestibility.
An additional power of using uNDF240 pertains to dry matter intake. Research is accumulating that suggests cattle have a uNDF240 steady state rumen mass. Research thus-far has been conducted with lactating dairy cows (Univ. of Bologna and WH Miner Institute) and it appears cows reach a steady state of approximately 4.5 kg DM uNDF240. And, a cow will consume an equal amount of uNDF240 as escapes the rumen daily. This can easily explain why cows fed soy hulls tend to increase total DMI as soy hulls are low in uNDF240. This area is still early in development and it is unknown how this will be expressed (uNDF240 intake, %BW, etc.) but can be used as a diagnostic aid now. Furthermore, given that the feed library is NOT populated with uNDF values for forages and non-forages, large amounts of data is required. The main feed labs are capable of analyzing feeds, keep in mind though that non-forages require different time points and must be done via wet chemistry whereas the labs have developed NIR calibrations for forages.
uN Ross
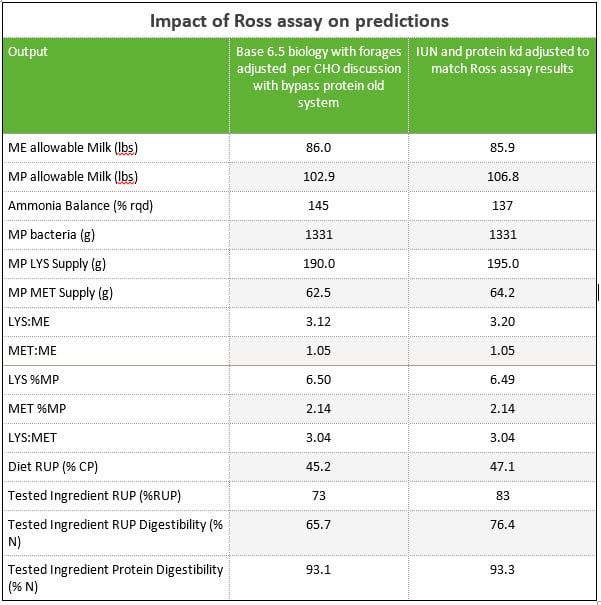
A commercial vegetable protein from Argentina was submitted to the Van Amburgh lab for the Ross assay for protein digestibility. For the purposes of this evaluation paper, the diet for the lactating cow post-uNDF and aNDFom for the forages was modified. The soybean meal inclusion rate was dropped to 4.82 lbs DM and 4.00 lbs DM of the by-pass protein was added. Using the results from Cornell, the degradation rates for the A2 and B1 protein pools were adjusted to match the RUP reported. The total indigestible nitrogen was inputted (IUN %N). When this occurs within AMTS, two things occur. First, the intestinal digestibility values for the feed are all set to 100% as the IUN inputted is the measured Indigestible. Second, the protein C pool switches to use the IUN input instead of the ADIP. Unfortunately, the results for this vegetable protein did not include the CHO fractions. However; this exercise clearly shows the impact of just the Ross assay.
As the laboratories implement the uN Ross assay, the ability to further fine-tune, make ingredient decisions, and improve amino acid formulation exists. This example clearly shows the potential impact.
Conclusions
This evolutionary step in CNCPS combines new laboratory methods and new modeling techniques. It is a major step in improving the models ability to predict cattle performance. As this paper has shown, simply moving to this new version improves the models amino acid predictions. As new data is inputted based upon the new laboratory methods (aNDFom, uNDFs, and the uN Ross), stepwise shifts in predictions occur. It is also known that we all will be running mixed systems as there are many feeds where we do not have the data to fully populate the library. As more data becomes available, the library will continue to evolve. However; these methods are available from the main laboratories thus nutritionists can begin populating their libraries with locally available ingredients.
As AMTS begins launching this new version that is 6.5 compliant, please do not hesitate to contact us with questions.