Carbohydrates are a big source of energy for people, animals, and the bugs that help a cow be a cow. Lately, looking at the Carbohydrate fractions, understanding the terminology, knowing what abbreviations constitute what fraction, in what the range of numbers the cow is most happy/productive, and how to read your forage analyses has been a little daunting in the dairy nutrition industry.
For example, let’s look at the CHO-C g, the undigestible potion of fiber in a given feed. In the past it was broadly characterized as the value of lignin * 2.4 based off work by Dr. David Merten’s on alfalfa or Lucerne in 1978. Compared to other analyses like CP, NDF, and ADF it is a rather crude analysis method really reflective only of Alfalfa; in other feeds it was inconsistent and incorrect.
Given what we knew at the time the recommendation for the CHO-C capacity in CNCPS 6.1 was in the range of 2200g-2600g. This was great! Nutritionist had a number to run with, all was good! Right? Well, kind of… When CNCPS 6.5 was released in October of 2015 industry was given a new way at looking at the CHO-C pool. The research gave us a dynamic rather than static rate (kd). Even more, the NDF was broken into pools: fast, slow, and undigestible, that, depending on the size of each, had bearing on the total kd of the feed. Those pools were designated by time points which also varied depending on whether the feed was a forage or non-forage carbohydrate. Fiber terminology, already a potentially confusing alphabet soup of initialisms, became even more so by the introduction of case and numbers to familiar initials. We were used to NDF, what the heck was aNDFom? What even was uNDF and what were those numbers? 30, 120, 240? Introduced in the change from CNCPS 6.1 to 6.5 the use of a dynamic rate calculator for determining the rate of fiber digestion and passage allows us to better predict the energy potential from feeds using a system that more closely mirrors how it actually behaves in the cow.
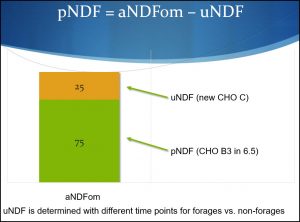
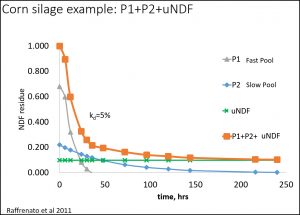
The term indigestible NDF was offered to represent the CHO-C pool. Some debates over mathematical definitions and semantics turned indigestible to undigestible. Going forward the uNDF is the undigestible NDF; the uNDF value gives a measure of the fill or how much space is available for the animal to take in more feed. Furthermore, we can calculate the digestion rates of this by using the time points 30, 120, and 240 for forages and 12, 72, and 120 for non-forages. The following charts courtesy of Dr. Mike VanAmburgh, from the work of Raffrenato, et al. illustrate, in a corn silage, the effect of measuring and combining the NDF values are the critical time points of 30, 120, 240 for forages.
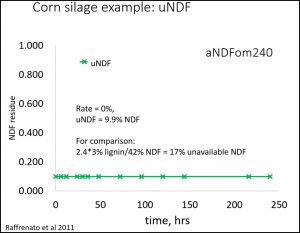
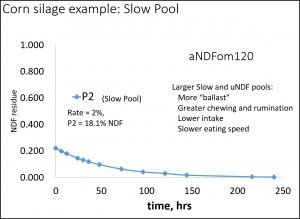
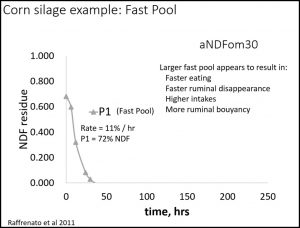
The three time points and amount of NDF in each pool is combined to create one rate for the forage.
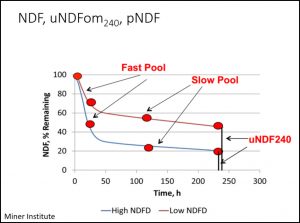
Using this analysis you can easily see the difference between two corn silages with different uNDF values. How much of the CS is available to for energy.
All the major labs are now measuring the time points so when you get your forages tested you can ask for the time points which will then be used to calculate the kd rate in CNCPS. That is great! NOW, we have a CHO-C pool that’s completely accurate, right?
Well, no, that only gets you the kd rate of forages. Unless you are have your non-forage fiber sources also tested, you will not have the whole picture. Currently in the AMTS library (which is the CNCPS Feed Library). As yet, there are no default kd rates using the 3 time points, there have not been enough samples run through the labs using time points to create a good data set. Remember the kd is DYNAMIC not really a book kind of value. So for now the number you’re seeing in the CHO-C g output is really a hybrid of your dynamic kds that you got by using the time points and the lignin * 2.4 of the feeds you do not have a dynamic number for yet. This makes this number lower than what it was in the past but definitely something you can still look at. You will have to observe where your herds are showing up on your output screen but 1200-2000g has been observed as a safe number. If you’re getting higher you may be seeing an intake depression. If you see less than 1200g you may see intakes much higher than they should be for the amount of milk being made. Research is continuing to see just what the bench marks are. Right now, use it as another tool for your tool belt.